
Analysing the weather charts
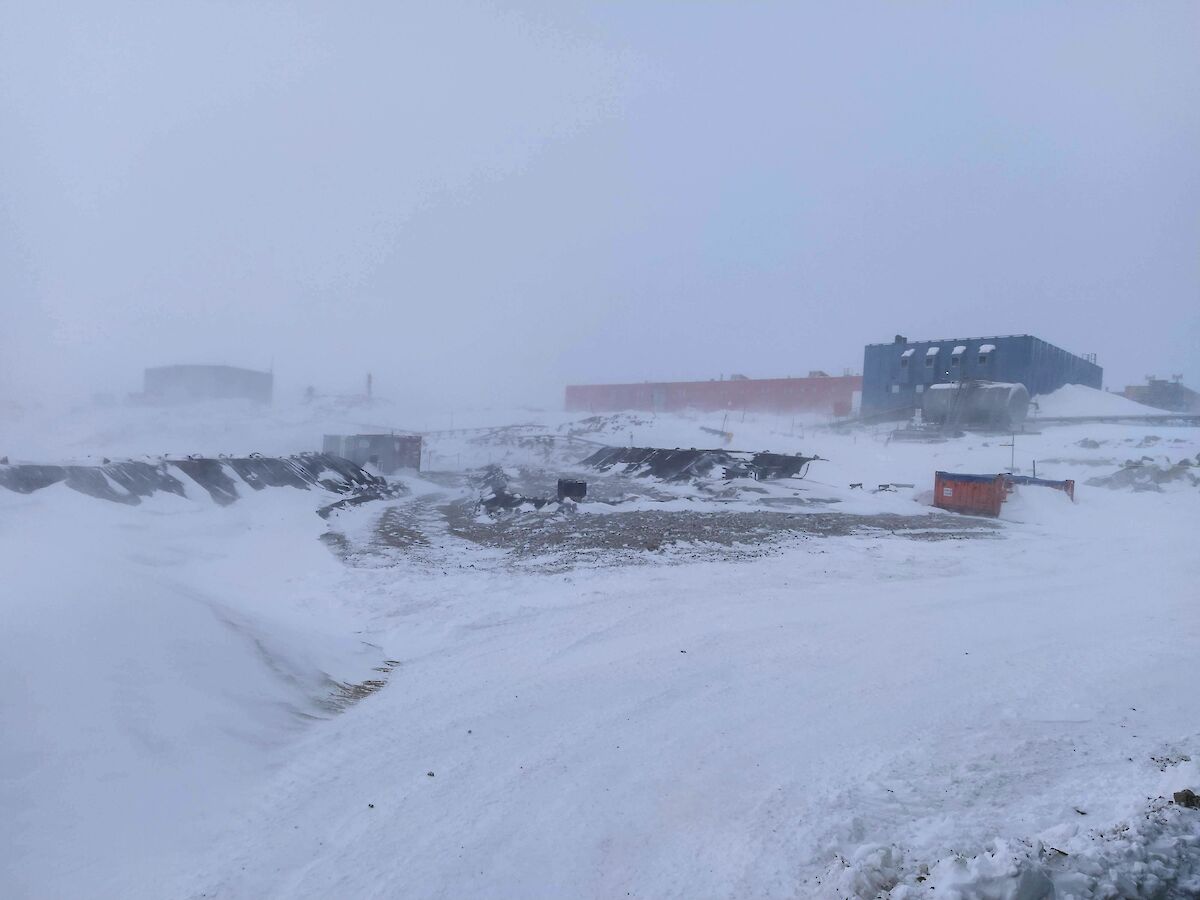
The midwinter fuel transfer is upon us. A roster is drawn up for the long cold job. We review drills, practice scenarios, and then a blizz hits.
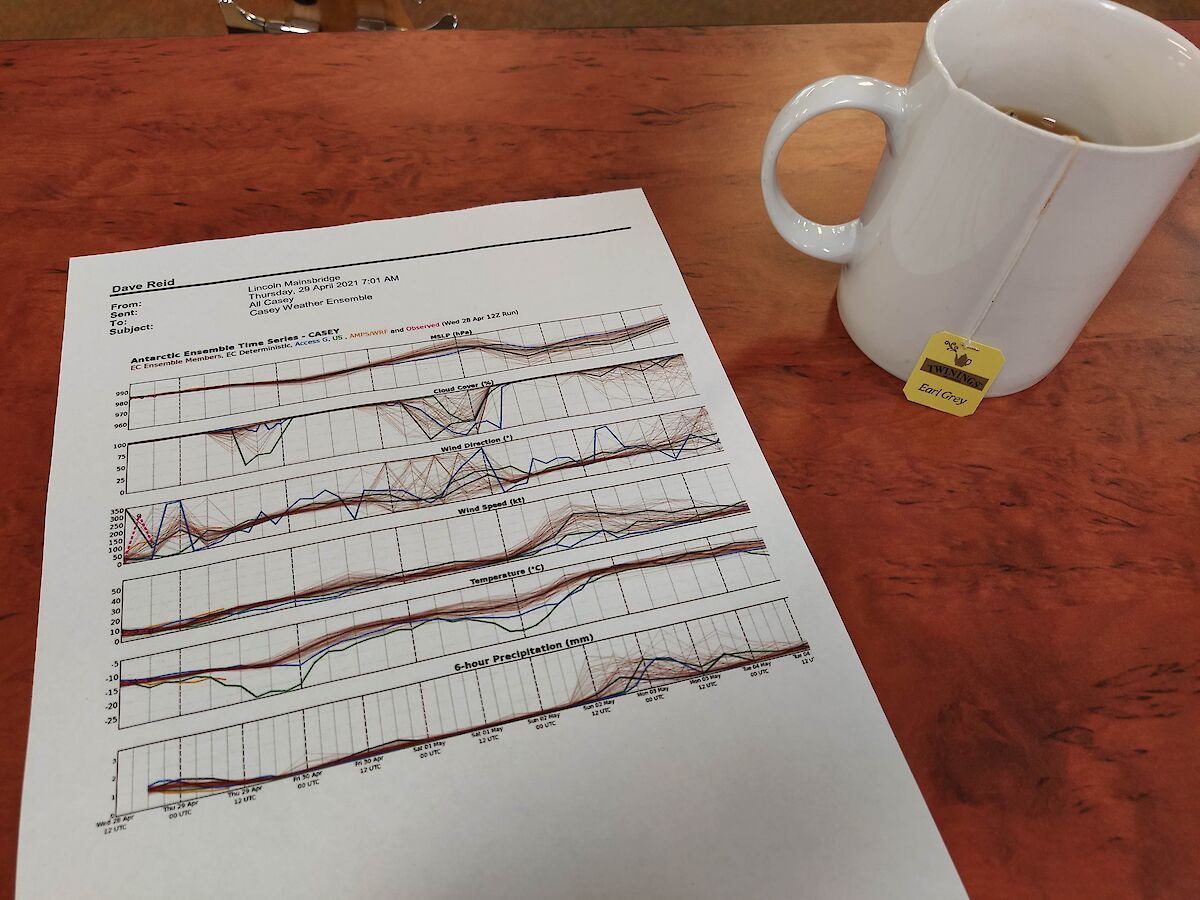
It’s fortunate our crack team of weather observers keep us up to date with a daily 'Casey weather ensemble' that some of us on station, including me, scrutinise. I seem to be hooked on those six rows of colourful line graphs and the data they represent. Thanks to this wizardry of truly complex science we were able to prepare for this blizz, well in advance.
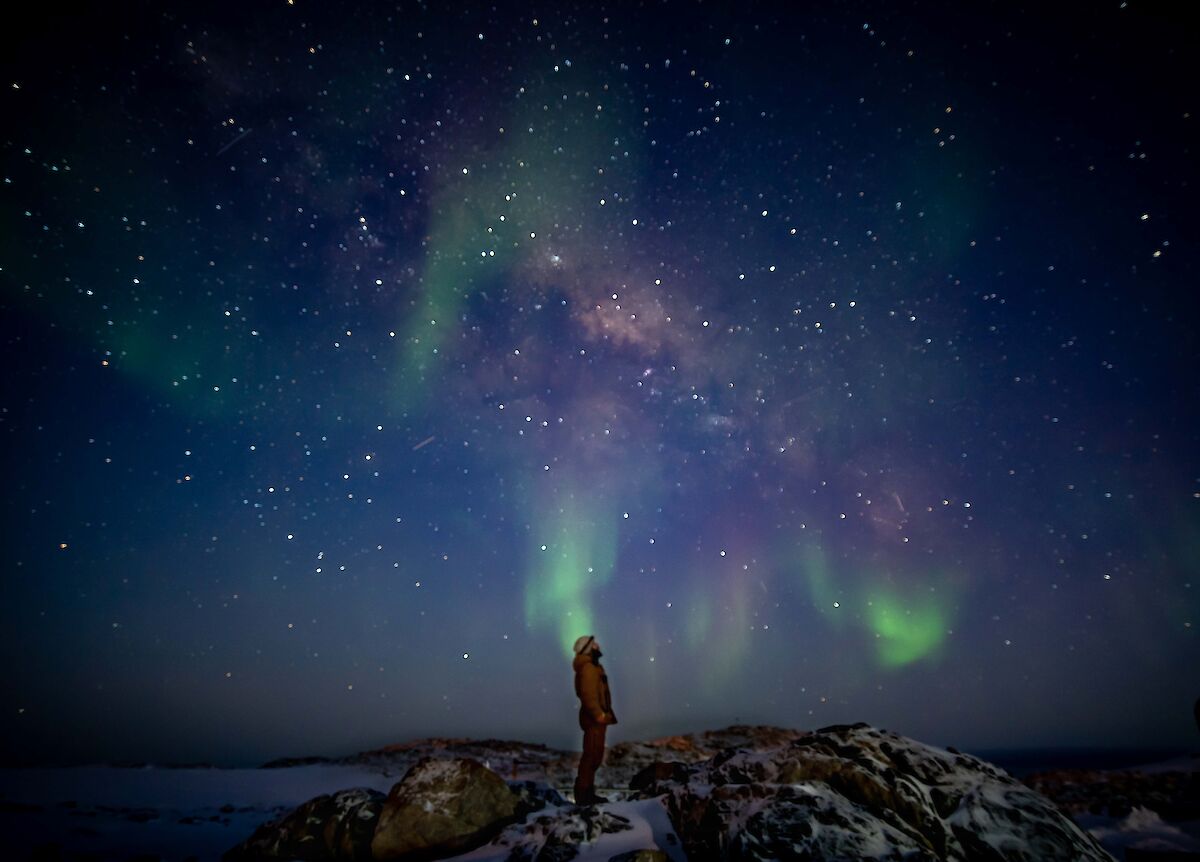
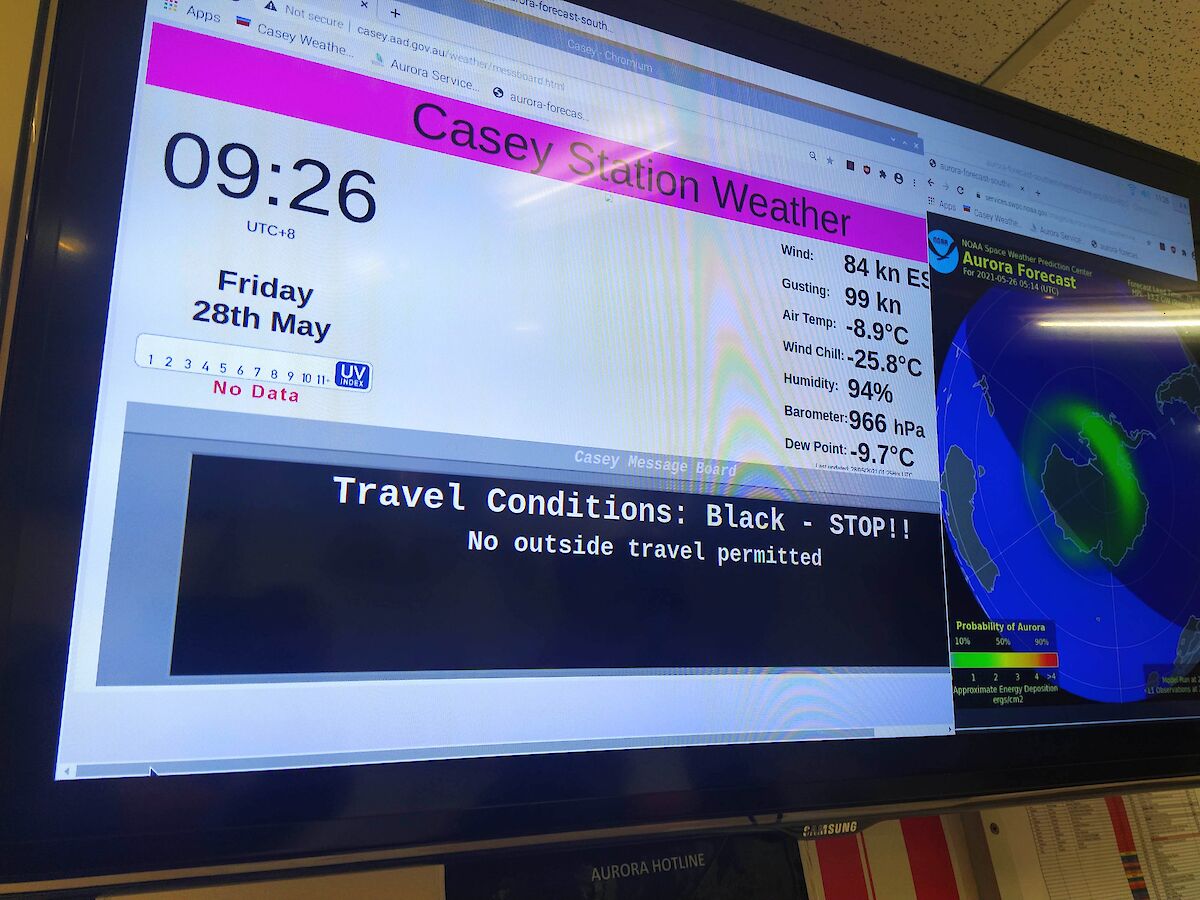
Days earlier the top of the ensemble reveals a high-pressure peak Thursday evening, dropping suddenly in the hours that follow. Blizz lines are set up around station. Below that row is the cloud cover percentage, or as I think of it, the 'aurora visibility gauge'. The most chaotic graph reveals the wind direction here at Casey, which despite its wild appearance, is simply from the south or east. A blizz from the east is good, because the temperature goes way up for some reason. That’s nice I guess. Below that is wind speed, the only graph that really matters here. It’s near zero knots days before the action. A calming lull before the storm. Then, sometime Friday night it kicks up. Way up… How high will it go? Eighty knots? Ninety? Maybe more.
At the bottom of the ensemble something else is revealing – snowfall – and a lot of it. It looks like it will take some time to clear the mountains of blizz tails that appear once the wind finally dies down.
And then the excitement is over and we’re all out there again, armed with shovels.
- Dave Reid (Casey Building Service Supervisor - Projects)