
Summer has arrived at Casey
Casey Station weather summary for November 2023:
We at Casey Station rely heavily on weather predictions and observations that our Bureau of Meteorology forecasters and observers provide on a daily basis. This is so we can fly safely, head out into the field or know what the outside working conditions around station will be. The following provides a synopsis of weather events on station over the November period. Of note, it's also interesting to compare these metrics to previous years – to determine how weather trends on station have changed when compared to historical data.
Temperature:
Unsurprisingly, there was a general warming trend over the course of November, with daily maximum temperatures climbing quickly in the first week, then levelling out within a few degrees of freezing for the latter half of the month. We had four days (all in the final week of November) peaking at or above 0 oC. Daily minima rose a little less rapidly and we were still seeing lows of −10 oC and below around the middle of the month. The 1st and 3rd of November were especially chilly with maximum tempertaures not exceeding −10 oC. Almost four weeks later we hit our hottest day at a balmy 1.5 oC on the 28th (the following day did not see temps dip below −1.3 oC). Our coldest temperature for November was −17.2 oC on the 3rd. Across the entire month, the average daily maximum temperature was −3.2 oC and average daily min temp was −9.1 oC. These values are just a tad cooler than the long-term means (calculated since 1989 for this site).
Humidity:
The water content of the air is recorded as 'relative humidity' (RH). Simple English Wikipedia says that "relative humidity is a way of describing how much humidity is present in the air, compared to how much there could be". Because I am simple (and English), this almost sums it up to my satisfaction, but I would add that when interpreting RH values, which are usually given as a percentage, read them as 'level of apparent moistness of the air' and not as an indication of absolute water content. You are not underwater at 100% RH, you are in (or very likely about to be in) fog, or maybe you've just cranked the sauna. Air over continental Antarctica is generally rather dry, but here on the coast we get some moistness off the ocean – especially when a trough over Law Dome encourages low cloud to come in from the NW.
A quick scroll through last month's RH values shows a typical daily range of 50 – 70%, with the odd dip down to 40% and spikes above 80% frequently coinciding with falling or blowing snow. During the afternoon and overnight fog spanning 29th/30th November we saw a climb in RH to 97%. RH values can swing +/− 30% or more over the course of a day depending on wind direction, the properties of the air masses sliding over us, and degree of surface heating from solar irradiance. Also, from negligent observers breathing onto the humidity probe during morning checks.
Atmospheric pressure:
Not that we mortals can really sense it, but mean sea level pressure (MSLP) peaked at 1010.0 hPa on the 26th. This was a little shy of the November record of 1010.5 hPa set in 2001, but hopelessly shy of the all-time record for Casey, which comes in at 1026.3 hPa, and occurred fairly recently on the 1st August 2022. We bottomed out on the 5th at 960.8 hPa, coinciding with a somewhat windy day. Average MSLP for the month was 982.6 hPa, fairly typical for November and close to the annual average.
Wind:
If you went outside at Casey in November, chances are the wind was blowing, and chances are it was coming from the east – or pretty close to from the east – and it was cold. However, looking at the data, we seem to cop quite a bit more westerly wind than I expected, it's just that when it blows from the NW through SW it tends to not nearly be as strong or consistent, and therefore it's less notable to the non-observer.
We had big blows on the 16th (winds gale force and occasionally exceeding storm force for about 14 hrs), on the 18th (blowing a gale for over 20 hrs) and 23rd (8 hrs of strong gale from midnight to breakfast), plus shorter spells of strong to gale-force winds elsewhere in the month. 10-min average wind speeds during these events typically ranged from 35 to 50 kt (65 to 93 km/h), often ramping up to sustained speeds of 60 kt (111 km/h) and over. The maximum gust for November was a respectable 82 knots (152 km/h) during the event on the 16th.
A mix of blowing snow, poor visibility and high wind is a regular attraction at Casey, but a technical blizzard is a harder thing to achieve, as it needs an annoyingly exact combination of these ingredients (plus a duration component) for us to declare one. Having said that, at intermittent points during those November blows we almost certainly tipped the blizzard threshold.
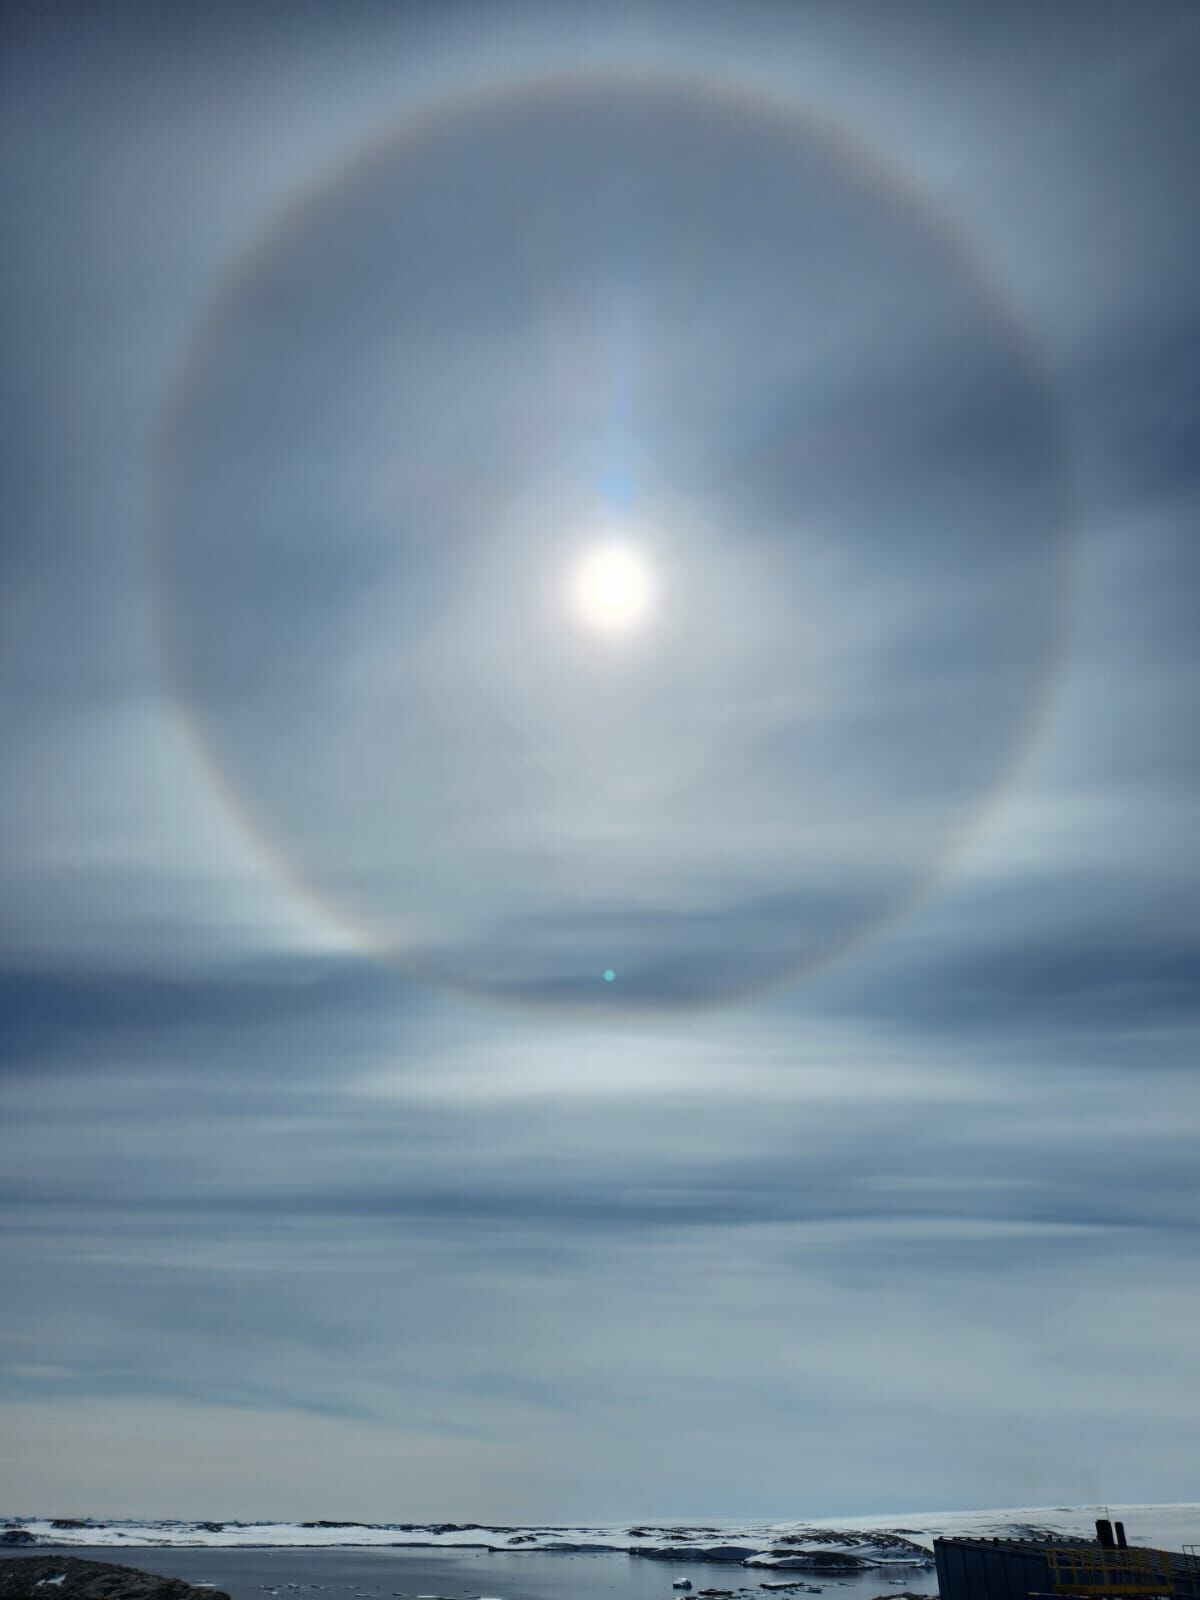
Sunshine:
Occasionally the sun came out in November which I think everyone agrees is a good thing. We measure sunshine in a peculiar 'old-timey' fashion using a Campbell-Stokes sunshine recorder, a crystal ball object which is mounted in the instruments enclosure near the Ops Building. Sunlight is focussed through the ball onto a paper strip. In this manner, the instrument is able to measure the duration of periods of solar intensity strong enough to burn or scorch the paper (a mark on the paper indicates the sun was 'out' or 'shining'). It's informative but not brilliantly so, and there are times when the sun can be 'shining' but not strong enough to burn the paper (such as when it's too low to the horizon). So, take the following information with a pinch of salt.
The second week of the month was exceptionally sunny, with the recorder registering an average of 12.3 hrs of burn time per day from the 8th to the 14th (the sunniest day was the 11th with 14.8 hrs burn time). Then, perversely, cruelly, the sun briefly reared its head on the 15th before disappearing for 5 days straight. It finally graced us with its presence again for 2.4 hrs on the 21st then not again for any appreciable stretch of time until the end of the month, save for a freak 10.4 hr stretch on the 23rd. On average, this November was about an hour and a half less sunny per day compared to previous Novembers at Casey.
Precipitation:
The end of November was the moistest, averaging around 90% RH across the 28th, 29th and 30th. Each of these days produced measurable amounts of precipitation (i.e. snow). Even so, 24 hr precipitation on these days was just 1.2 mm, 1.4 mm and 0.4 mm respectively – not exactly a deluge. In fact, whilst snow and other frozen stuff was seen falling out of the sky on half the days in November, the only other day to receive measurable precipitation was the 22nd, coming in at 0.9 mm. This is because I can't squint hard enough to read the gauge in increments smaller than 0.1 mm. So, we record anything less as 'trace' amount. The long-term average total November precipitation for Casey is 11.9 mm, so this was a comparatively dry one.
Summer has arrived at Casey station which not only sees operations in full swing, but also promises to deliver more impressive meterological magic over the coming months!
- Thomas Windsor - Bureau of Meterology Weather Observer