

High-resolution three-dimensional (3-D) maps of the sea-bed gave researchers a new window into the deep during the recent Collaborative East Antarctic Marine Census (CEAMARC).
The 3-D maps of the sea-bed offshore of Terre Adélie and George V Land, were generated using the latest multibeam sonar data collected by previous research voyages to the region. The maps provided an accurate picture of the depth and shape of the sea-bed, allowing scientists to precisely target the sea-bed with their sampling gear.
Multibeam or ‘swath’ sonars are advanced echosounders mounted on ships to accurately map vast areas of the sea-bed. Unlike the more familiar ‘singlebeam’ echosounders, which transmit a single, narrow sound pulse directly under the vessel, multibeam echosounders transmit a wide fan of sound either side of the ship and receive multiple beams of sound reflected off the sea-bed. Each beam represents an individual ‘sounding’ or depth point. As the fan of sound can have a spread of up to 75 degrees either side of the vessel, and transmits hundreds of times a second, the result is a detailed 3-D picture of the sea-bed made up of millions of individual soundings.
The sea-bed data collected by multibeam sonar can be as good as anything seen on land using satellites. Depending on the depth of the water, the technology can detect features as small as a brief case and has been a vital tool in detecting vulnerable marine ecosystems, such as seamounts, cold water corals, submarine vents, and even shipwrecks and other artificial structures. In Antarctica, multibeam has been used to map the iceberg scours and deep glacial trenches, and to detect undersea moraines left by retreating glaciers.
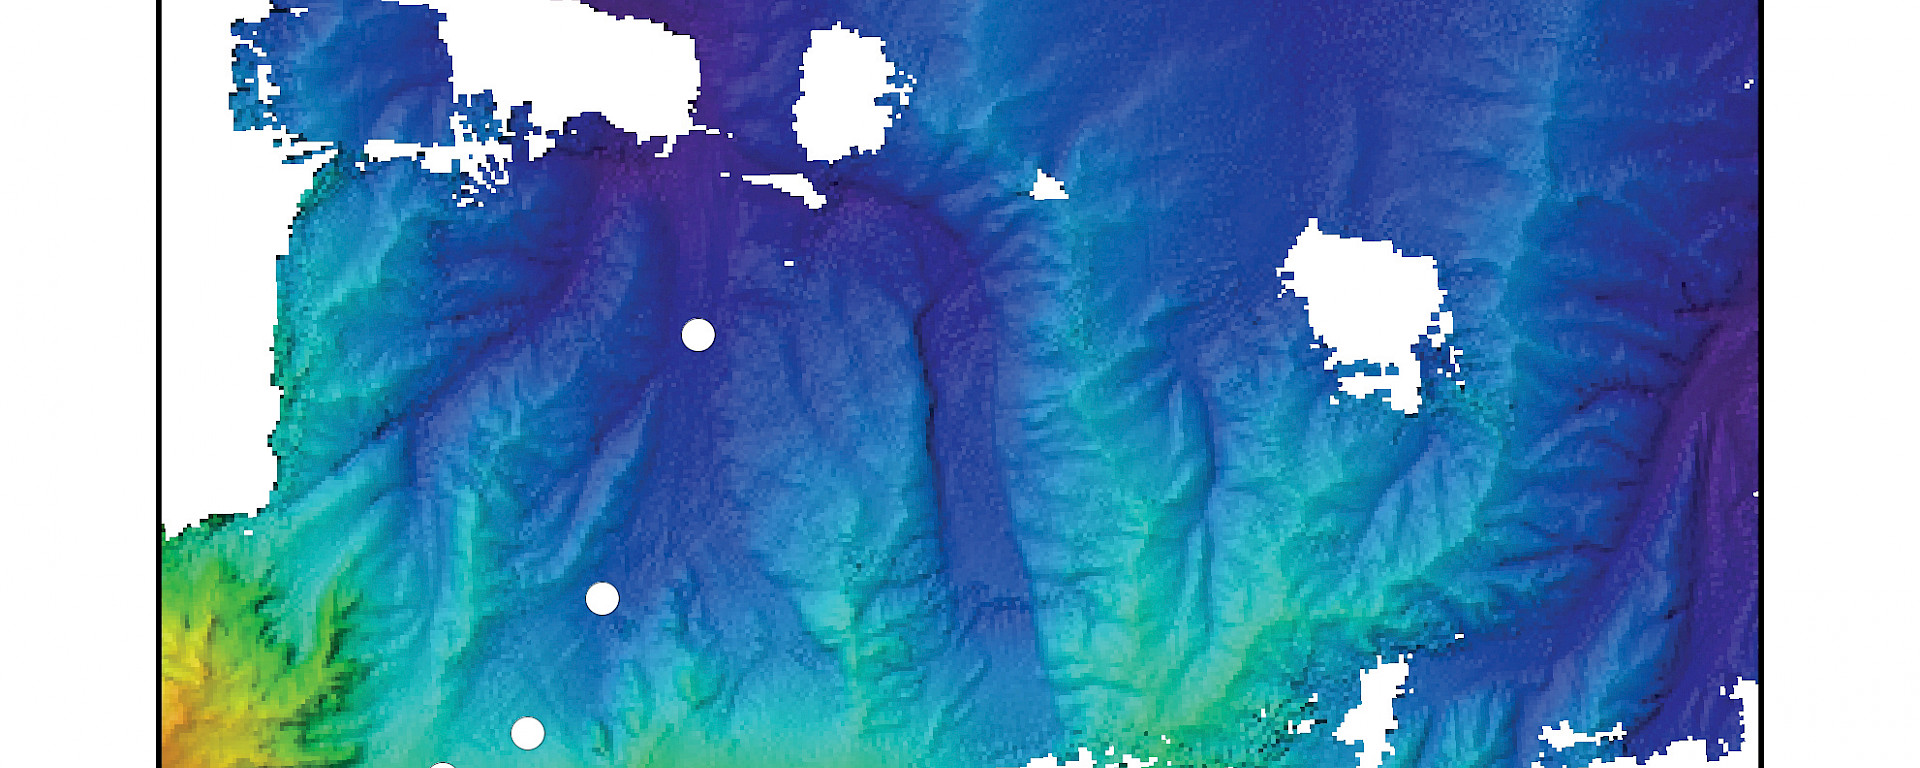
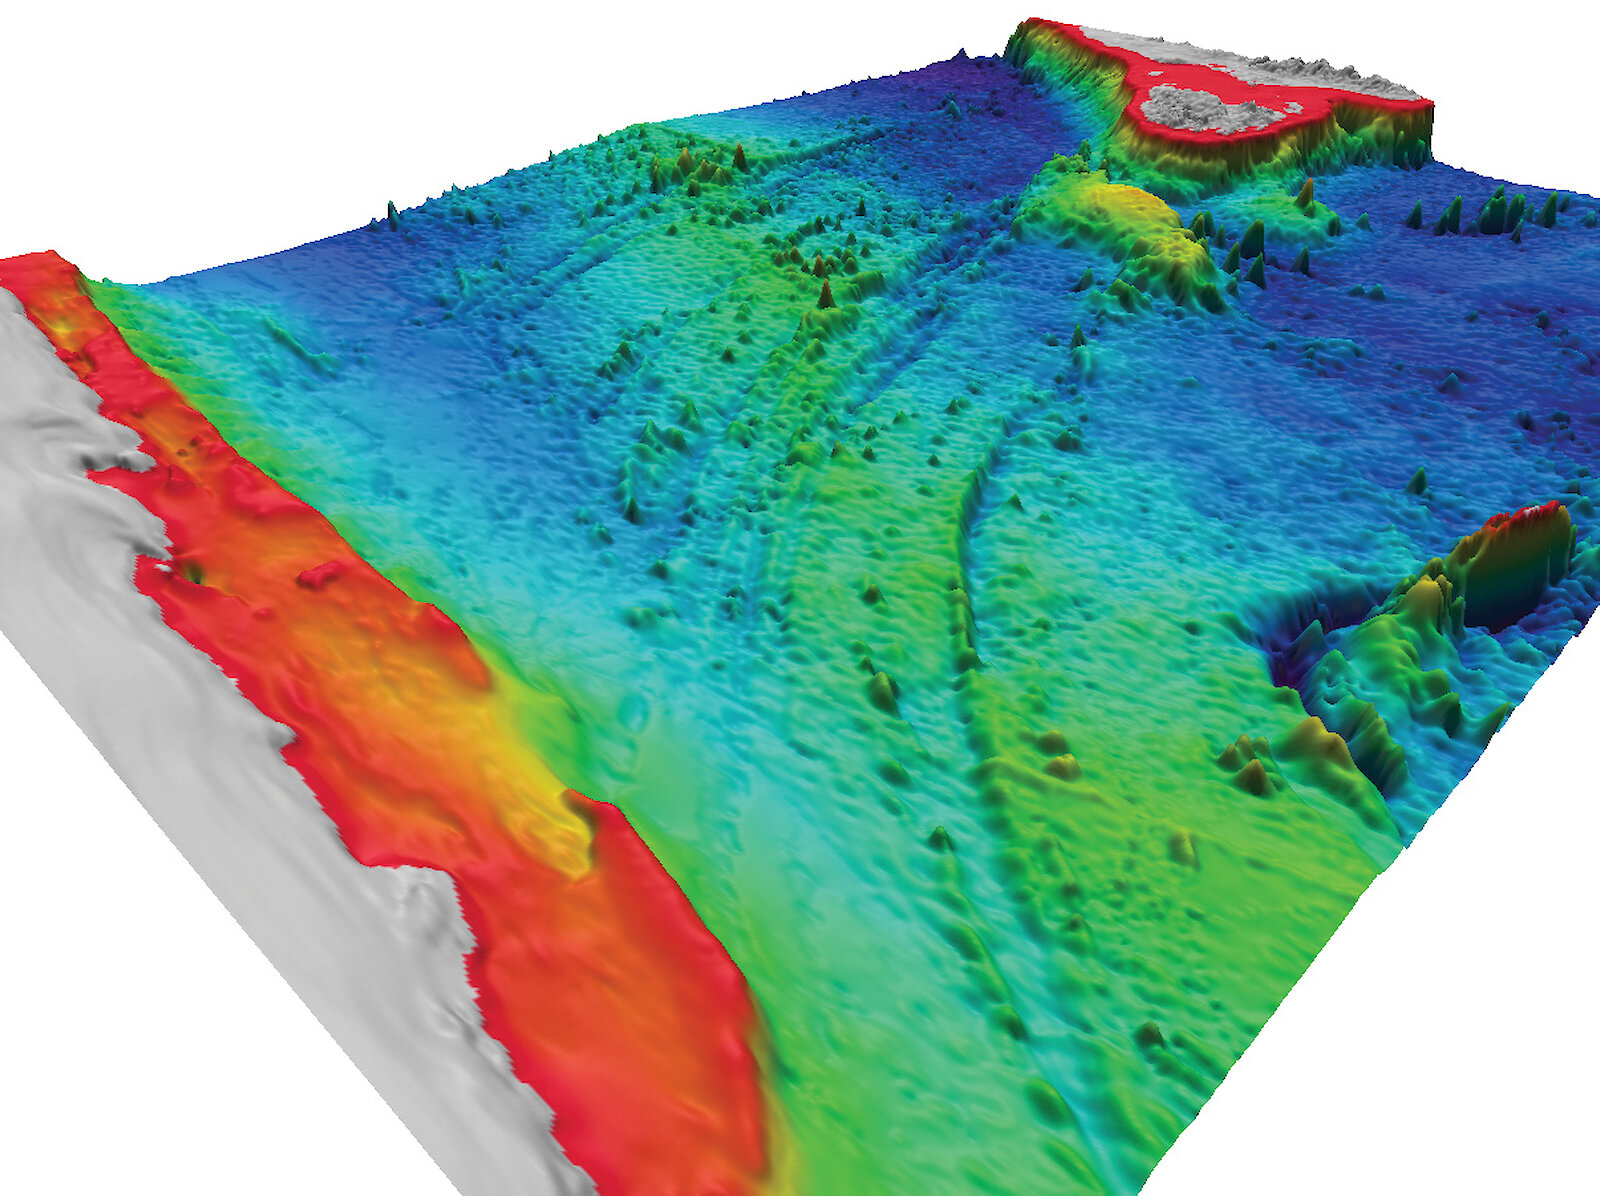
The multibeam data, which is archived in digital files at Geoscience Australia, were combined in 3-D visualisation software and a rainbow colour applied to the final surface, according to depth. Red to yellow colours represent shallower depths and blue to violet colours represent deeper depths. The surface was also given artificial sun shading to provide shadows, which highlight any relief or bumps on the seabed. The visualisation software is used to fly through the seascape or simply provide plan-view maps for use in a geographic information system.
For the CEAMARC voyage to the Terre Adélie and George V Land shelves, the 3-D underwater landscape or ‘seascape’ maps were used to give precise locations for sampling different underwater habitats and provide a geological context to the survey area. For example, in the George V Basin — an approximately 1300m-deep glacial trough on the shelf — maps show long ‘megaflutes', or scours, from the passage of the Mertz Glacier. Underwater cameras precisely targeted the megaflutes and found a seascape that looked like rolling dunes, where most of the attached fauna was concentrated along the ridge tops.
Another example was submarine canyons, which had deeply incised the continental slope to drain sediments and Antarctic bottom water off the shelf. Researchers were able to precisely drop cameras, trawls and oceanographic instruments into the canyon axes to record the marine life and environment in these very rugged features. The random, shallow scours left by icebergs on the shallower bank tops could also be seen in the 3-D seascapes, and cameras towed over the scours showed the dramatic contrast between the undisturbed marine life outside the scours and what remained in the scours after the icebergs had left.
The 3-D seascape maps were invaluable decision-making tools for the CEAMARC survey. However, the benefits of multibeam surveys extend beyond sea-bed sampling and include safer navigation charts around our Antarctic stations.
The data were collected by the vessel OGS Explora in the summer of 2006/7 and kindly made available by Dr Laura De Santis (Italian National Institute of Oceanography and Experimental Geophysics) to assist the CEAMARC project.
DR ROBIN BEAMAN
School of Earth and Environmental Sciences, James Cook University