
Dr Heil said the historical ice and ocean data and the ability to superimpose past or proposed ship trajectories or animal or instrument tracks over the data, made it a powerful planning, analysis and research tool.
The tool includes sea-ice data dating back to 1980, chlorophyll data from 1998 and sea surface temperature from 1981.
“We have used this tool to plan a marine-science voyage, and are currently using it to pinpoint deployment locations for autonomous instruments to study ice-edge processes, such as wave-induced ice breakup,” Dr Heil said.
“The tool allows us to look back at the sea-ice concentration and extent over the past few years to gain an understanding of the likely sea-ice conditions in the month of our voyage. We can then identify the most suitable location to take samples and deploy instruments.
“The tool also allows us to look at ice conditions in locations where we may have limited or no experience in navigating the ice area, and make decisions about the best time of year to visit to achieve our objective.”
Mr Chua said the ability to look at different ice and ocean variables at the same time could spark new research ideas, or enable scientists to explore links between different Earth system components.
“If you’re an atmospheric scientist sampling air from a vessel and you see a signal that does not make sense, you could look back at the ice or chlorophyll conditions at the time and location of your signal and check for any correlation,” he said.
“Phytoplankton may have released sulphate aerosols into the air, affecting the atmospheric properties, for example. So having all these data in the one interface enables connections between scientific disciplines.”
To build the mapping platform the team used existing data sets generated from satellite observations. Data sets came from a range of sources, including the National Snow and Ice Data Center, Unversität Bremen, the Met Office and the Ocean Colour Climate Change Initiative.
Data sets include daily and monthly sea-ice concentration (amount of sea-ice cover), sea-ice freeboard (height above the ocean surface), chlorophyll concentration and sea-surface temperature. They also include in-house derived parameters.
“In consultation with Antarctic scientists, we chose source data and products that would be the most useful for looking at the long-term climate record,” Mr Steketee said.
“We standardised that data, added some functionality, and presented it on a platform that doesn’t need any technical expertise to use.
“This tool does not require any software or downloads to run, it can be configured to run without an internet connection, and it displays multiple variables at different time scales.”
Dr Heil said the availability of different sea-ice variables within the one application was also important in teasing out sea-ice conditions. For example, an area of interest could show 100% sea-ice concentration. However, including the sea-ice freeboard variable (height of sea ice above the water level), could identify areas of thicker or thinner ice within.
“An area of interest may be 100% covered in ice, and only the freeboard data will show whether it is freshly frozen over and very thin, or if it’s thick, multi-year ice that one would not want to venture in to,” she said.
The development team said the mapping platform could also be used by students to conceptualize climate variability, or to provide climate modellers with an accessible, visual means of comparing model outputs with actual observations.
“There are many ways to look at sea ice in Antarctica, but our tool brings together a diverse set of observations to explore Earth system characteristics and processes that are relevant to the Australian Antarctic Division and the Australian Southern Ocean science community,” Mr Chua said.
“While people can view many of these variables in isolation, the power of our mapping tool is in the combination of variables and the ability to overlay them within an accessible interface.”
The tool is available at nilas.org. The Australian Antarctic Data Centre houses the software and data in the Australian Antarctic Data Centre.
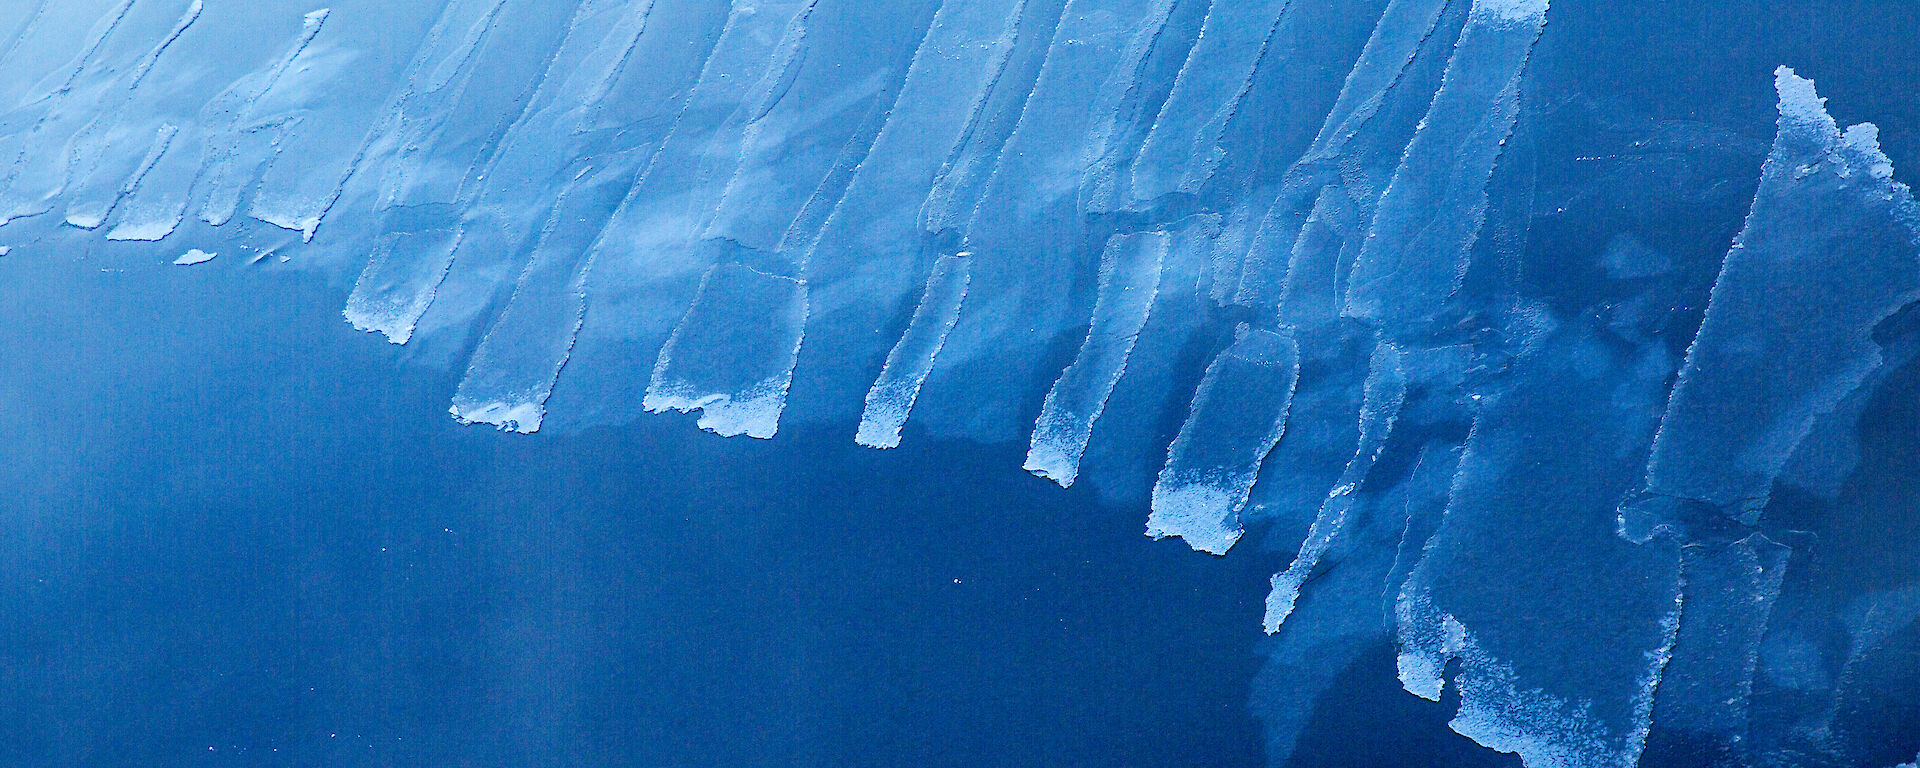
*Nilas is a thin, elastic crust of sea ice, that easily bends on waves and swell, and under pressure. Learn more about nilas ice and other stages in the development of sea ice.